
- Did you know the same OEE number can mean very different things?
- OEE does not provide the ‘Why’ if a problem occurs.
- Performance, quality, and availability are best analyzed as separate measures.
- Evaluating all three provides a bigger picture of how a factory floor is operating.
In order to keep up with global competition and growing consumer demand, manufacturers must ensure their factory floor operates efficiently. In today’s industry, OEE is considered a foundation of peak industrial performance. But, there are very real concerns about evaluating performance based solely on OEE.
Is OEE a Flawed Manufacturing Metric?
Yes, OEE is absolutely a flawed manufacturing metric, and there is one big reason for that. OEE multiplies three different percentages together which basically gives you an arbitrary number. If OEE is low, it will tell you things aren’t going well or performing how they should, but there is no detail. How can you fix a problem without knowing the source of the problem?
OEE can show performance, quality, and availability problems, but as mentioned before, there is no context. If you look at OEE, you can see it is less than optimal, but you don’t really know why, for example, where the reduced product quality is coming from or how bad it truly is.
Using the Mingo OEE calculator, we inputted various data. Let’s go through those examples.
EXAMPLE 1
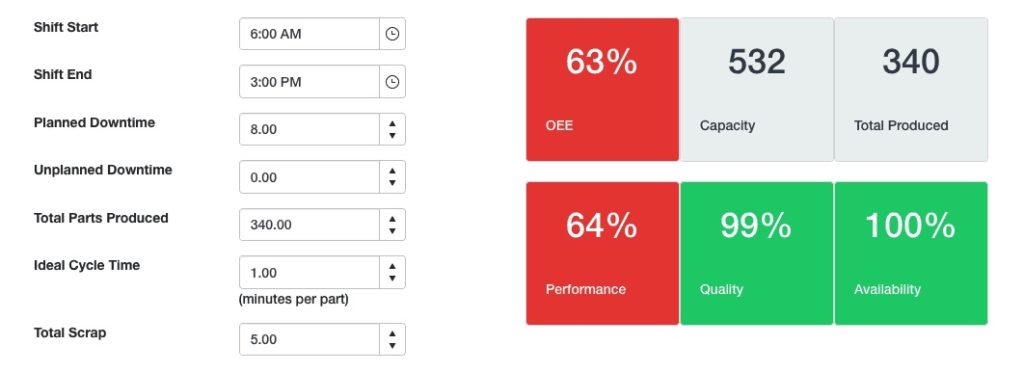
In example 1, we have a shift that starts at 6:00 am and ends at 3:00 pm. There are 8 minutes of planned downtime and no unplanned downtime. We produced 340 parts during this time but based on our initial cycle time and the availability of the machine, we should have made 532. We produced 5 scrap parts which means 99% quality.
Our performance number is 64%, quality at 99%, and availability is 100% which gives us an OEE of 63%.
EXAMPLE 2
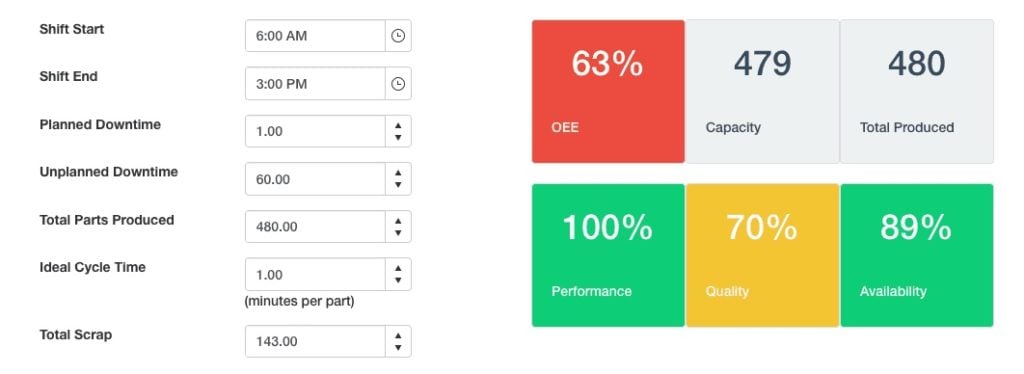
In example 2, you’ll notice we have the same OEE number, but performance, quality, and availability are very different. The shift still began at 6:00 am and ended at 3:00 pm and our ideal cycle time is still 1 minute per part, but that is where the similarities end. In this scenario, there is 1 minute of planned downtime and 60 minutes of unplanned downtime. We produced 480 parts, 1 over our anticipated capacity of 479 resulting in a 100% performance rate. 143 those parts, however, were scrap which gives 70% quality.
Our performance number is 100%, quality at 70%, and availability is 80% which gives us an OEE of 63%.
EXAMPLE 3
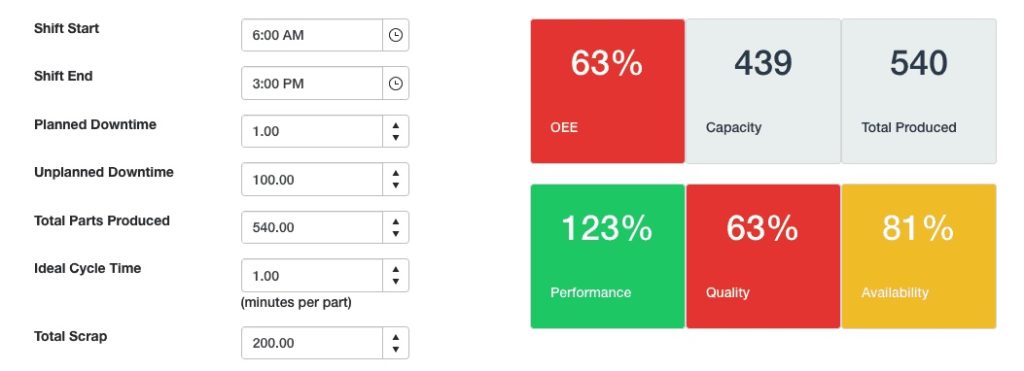
Example 3 tells a different story entirely, but you’ll notice a trend at this point – OEE is still 63% even though performance, quality, and availability are very different. Again, the shift starts at 6:00 am and ends at 3:00 pm. The ideal cycle time is still 1 minute per part. There was 1 minute of downtime and 100 minutes of unplanned downtime. 540 parts were produced, 101 more than the capacity of 439 which resulted in a 123% performance number. We had a total scrap rate of 200 resulted in 63% quality and 81% availability.
Our performance number is 123%, quality at 63%, and availability is 81% which again, gives us an OEE of 63%.
EXAMPLE 4
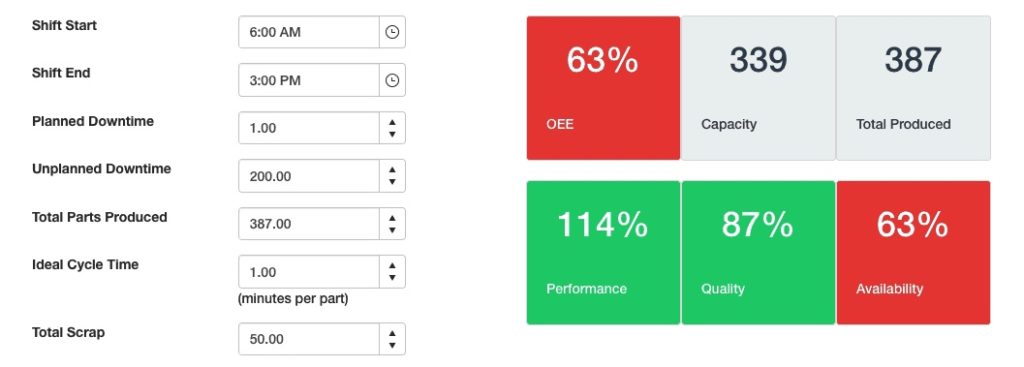
In the final example 4, OEE is again 63%. Two things remain the same – shift start and end time and ideal cycle time. There was 1 minute of planned downtime and 200 minutes of unplanned downtime, resulting in 63% availability. 387 parts were produced resulting in a 114% performance number because the original capacity was 339. Total scrap was 50 parts, giving us 87% quality.
Our performance number is 114%, quality at 87%, availability is 63%. The OEE is unsurprising, 63% yet again.
As you can see, the same OEE percentages were achieved, but the factors that contributed to that number were completely different. In the first example, quality and availability were perfect, but the performance was subpar. For example two, performance was perfect, but quality and availability weren’t meeting standards. The next two examples follow similar formatting – differing factors can make different impacts, but the OEE number remains the same.
How do you know which metric is affecting the OEE number without looking at all of the data used to create that number?
“Is OEE a Good Metric?”
OEE by itself is not a good metric, but the components that make up OEE are great. Availability, performance, and quality are really good, valid metrics on their own because they provide a bigger picture of what is really happening on your factory floor.
Think about it in this way – what’s measured gets managed. If you’re only measuring OEE and not looking at the factors that contribute to OEE, you will miss valid data points that can help you improve your manufacturing process. The process and discipline of collecting and looking at data are very important in creating a more efficient and effective factory floor.
If one data point is not measured or managed, the problem can grow out of control and cause an even bigger problem for the company. Or the alternative is that even if there is no problem, your company will continue to do things as you always have, missing the opportunity for growth.
OEE is a central metric in the manufacturing industry, but there are shortcomings to consider.
Again, Remind Me How OEE is Flawed?
As we illustrated in the above scenarios and corresponding screenshots from the OEE calculator, OEE is a significantly flawed manufacturing metric because different combinations of availability, performance, and quality numbers can equal out to the same OEE number. To dive even deeper into why that is a problem, consider the implications of the different numbers.
If a performance indicator is low, that’s a problem, but it won’t necessarily mean the downfall of your company. It just means the factory floor is performing at a slower than expected rate. But, let’s say the quality number is significantly lower than its benchmark. In that case, less than optimal quality products are being produced which could be detrimental for your company and potentially put you out of business.
For some manufacturers, 10% quality won’t make or break a process, but it definitely will for airplane or car part manufacturers, especially if those quality issues make it out of the door. Quality is a huge factor.
These are all things to consider when thinking about OEE as a flawed manufacturing metric.
“What Does Flawed OEE Mean for My Business?”
Consider a job shop versus a manufacturer that makes only a few products. In a job shop, different products are being produced all of the time. They are engineered to order. That shop may not make the same part again so what they care about in OEE is different than someone making a million of the same part every single day.
A job shop cares about:
- How often machinery is used
- How to optimize machinery when a product needs to be produced and sent quickly
- How to be flexible enough to run machinery for whatever product needed, when it’s needed
A high-volume manufacturer cares about:
- The throughput of a machine or line
- The uptime of a machine or line
What kind of industry do you work in? What factors do you need to consider when evaluating the effectiveness of OEE?
What Will Better Evaluate Machine Productivity?
This is a difficult question to answer because as we explained above, the answer is different for every company. Not only that, but whatever evaluation method is used can potentially change over time.
The components of OEE – availability, performance, and quality – are good metrics, and quite frankly, a better way to look at things. Just looking at OEE as one metric is not as effective because it hides so much detail.
What are you trying to improve? That is what you should measure and display.
