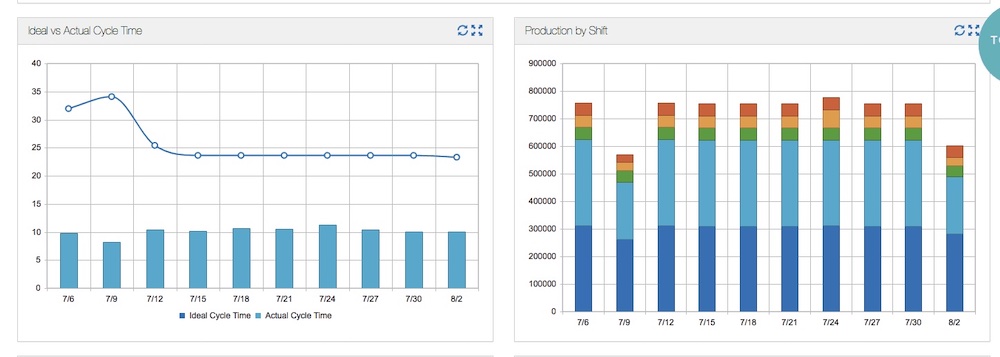
- How can you keep up in manufacturing without data to provide helpful insights into your factory floor?
- Once data is gathered, how can you use data visualization in manufacturing?
- Data visualization can help point out patterns and help to not overlook those patterns.
What Data Should Manufacturers Try to Visualize?
The idea of visual management on a factory floor, commonly referred to as a visual factory, is that you need visuals to provide an idea of what’s going on in the current moment.
Think of an Andon system – it’s one of the most commonly used visual management systems in lean manufacturing. If you’re not familiar, an Andon system is a display station for what is happening on the plant floor. There are two types of Andon systems – manual and automatic. It allows an operator to view processes on the line, and if an issue arises, quickly devote resources to fix that issue. The idea behind an Andon system is to eliminate bottlenecks and increase efficiency.
As we continue to discuss data visualization in manufacturing, keep the idea of an Andon system in the back of your mind. It will help you to visualize what we’re talking about. (Get it, visualize? Witty, we know.)
What is a Visual Factory?
Plain and simple, a visual factory is focused on using visual information on the factory floor. Things like signs, labels, charts, and infographics are used to leverage the abundance of data in an efficient, yet effective way.
How Can Data Visualization in Manufacturing Help Identify Trends?
Data is important. We can’t do without it in today’s world. Without data, we’d be guessing and hoping we made the correct decision. By gathering, analyzing, and visualizing data, identifying trends becomes possible and manufacturing excellence can be achieved.
There are two main categories of data that can be gathered – quality and a day-to-day comparison. Once gathered, data visualization can be used to answer important questions regarding the health of a plant floor.
Quality
- Is there a machine that’s not running?
- What is performing well and what isn’t?
- As quality problems increase, where are they coming from? Why are the problems occurring?
Day-to-Day Comparison
- How did we do yesterday? What were our problems?
- What do we need to do today to fix those issues we observed?
- Are we on track hit our goals for the week? The month? The year?

How do Manufacturers Typically Visualize Data?
Many manufacturers will have a communication board which is essentially a whiteboard with written numbers and hourly totals. Reports, graphs, and charts are used to visualize that data. It includes information about what happened yesterday or last week. This method is often inefficient and difficult to maintain.
With the use of an automated platform, data can be gathered and fed into a scoreboard which provides a visual of the data collected in real-time. Technology can be incredibly beneficial when used to make processes more efficient, such as in the case of data visualization in manufacturing.

What Challenges are there with Visualizing Manufacturing Data?
Keeping it up to date. That sounds simple, but if you consider the size and breadth of a company, it can be very difficult to consistently update information. An automated data system eliminates the need to monitor and refresh an Excel sheet, a traditional piece of paper, or even a whiteboard. How much time could you save by automating data visualization?
Think about data and all the things it can tell you. Data is a great resource if gathered and visualized correctly, but that often becomes a major challenge. What happens if the wrong data is represented or calculated incorrectly? Or maybe, the data changes over time and is never updated?
There is another challenge to consider, too – the culture challenge. If you are currently not tracking any data or not sharing the information with employees, the second you start sharing the data, employees will want to know how data is gathered. Since employees are responsible for obtaining those numbers, they will want to understand how the numbers are calculated and used, and rightfully so.
That challenge creates the need to message data properly – understand where we are as a company, where we need to improve, how to use data to improve, and effectively utilize a management tool, together as a company.
The danger of using data, without any understanding of why is that fear is created. If data is gathered and there is no data visualization in manufacturing to understand why a number is lower than it should be, an initial reaction would be to blame the employee. Instead of that scenario, understanding the data through data visualization can help the plant manager realize a specific machine is not performing as well as its counterpart, to no fault of the employee.
Data visualization provides valuable insight into the why of a factory floor.
What is the Best Way for Manufacturers to Start Visualizing Data?
No, the answer is not using Excel data to create a dashboard. Manufacturing is fast-paced, and as a result, it needs a fast-paced solution to keep up with the ever-changing industry. The solution is Mingo. With our software, you can see, in real-time, data as it comes in. Using those insights, you’ll be able to make decisions that can benefit the entire factory floor.
Keep in mind that in manufacturing, even small bouts of downtime can greatly affect the bottom line. Automated data visualization is more important now than ever.


