- Product
- Solutions
Case Studies
Automation
Versatech Increased OEE 30%Consumer Package Goods
Oral Biotech Eliminated ScrapFurniture
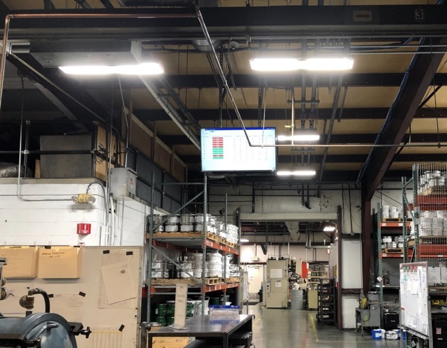
Tacony Reduced Lead Time 150%Metal Stamping
H&T Waterbury Reduced Downtime 71%Blow Molding
Lyons Blow Molding Automated Reporting & Labeling - Resources
- Blog