STARTER MANUFACTURING ANALYTICS
Get Off Paper & Excel
A surprising number of manufacturers still use manual data collection like pen & paper or excel spreadsheets as their primary reporting tools. If you are one of them, Starter Analytics can help.
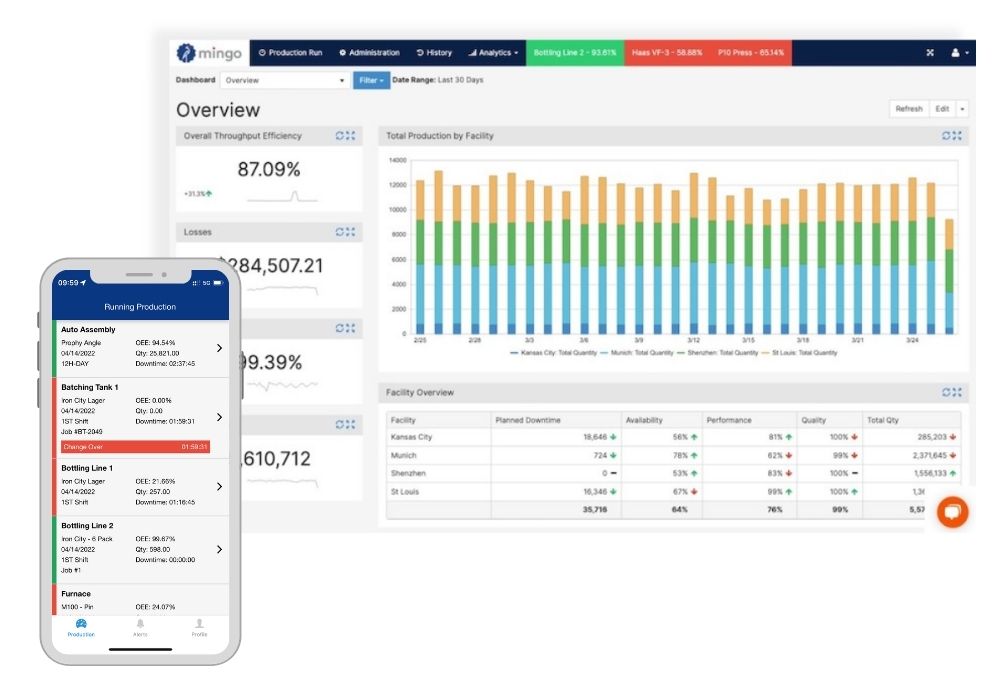
The Starter package of SensrTrx Manufacturing Analytics provides contextualized manual data collection, calculates meaningful manufacturing KPIs and displays them in actionable dashboards that everyone inside your organization can use on day 1.
Reduce Time-consuming Reporting Tasks
Fully manual data collection is a full-time job for many manufacturers, save your employees and supervisors valuable time assembling weekly or monthly reports.
Improve the Reliability of Your Data
Spreadsheets are notoriously error-prone. Avoid common mistakes and human error using SensrTrx to collect and contextualize production data on your machines and operators.
View Reports
By putting your data into the SensrTrx cloud, reports can be viewed immediately. Start and end your shifts daily with timely reporting on what is affecting productivity.

Report on Downtime
See reporting on planned and unplanned downtime during each shift and track specific downtime reason codes.
Report on Part Counts
Operators can report on start and end counts for their shift or production run for accurate cycle information. This data on can then be viewed in the context of downtime, part # and analyzed against target production values.
Report on Scrap
Reporting on scrap, defects or bad parts allows for more accurate accounting and a reliable quality metric. Add scrap reasons to further indicate the greatest areas of loss during production and reduce costs on the plant floor.
Reliable Data Capture
Using a simple operator user interface, SensrTrx makes manual input of relevant production data easy, automating production schedules and allowing for operator input on downtime, part counts and scrap.
Tablet-based operator Input
User-friendly interfaces provide an easy way for operators to view and select:
- Downtime & Downtime Reasons
- Part Counts
- Scrap Rates
Use a “smart” shift calendar
Create a shift calendar to automatically provide operator context to your job schedules. Put data in context of day/time, part #, machine/cell, and shift information.

Provide Plant-Wide Visibility
Timely and accurate data to everyone that needs it.

SensrTrx Scoreboards provide real-time visibility by machine and cell.
SensrTrx Starter puts your production data in the hands of your employees. Operator screens show detail by machine and provide manual input on downtime and scrap, scoreboards provide real-time updates to performance and downtime, while dashboards give managers unprecedented visibility on the line. SensrTrx starter provides:
- Operator User-Interface
- Scoreboards for Plant-wide Visibility
- Dashboards for Managers and Executives
- Alerts and End-of-Shift Reporting
Scoreboards
On the plant floor or breakroom, use scoreboards to show machine and cell performance and overall OEE.
Triggered Alerts
As unplanned downtime or quality issues mount, SensrTrx can send alerts regarding downtime and scrap.
Send Dashboard Reports by Email
End-of-shift or production run reporting provides supervisors with data to see issues and understand the factors impacting productivity before they add up.
SensrTrx Dashboard Reporting
Throughput and Capacity
Immediately report on actual vs. target production numbers. Make sure schedules are met and customer orders are on-time.
Downtime
See downtime reporting by machine, cell or line. Stop bottlenecks and maintenance issues before costs pile up.
Scrap
Avoid costly scrap and quality issues. Track these by part and job to fine-tune cost reporting and reduce rework.

View the 4-Minute Demo on How SensrTrx automatically generates end-of-shift, daily, weekly and monthly reporting.
SensrTrx Mobile for Monitoring and Alerts
Gain visibility onto the plant floor with your machine and operator data in real-time. SensrTrx Manufacturing Analytics provides machine cell OEE, downtime and scrap alerts optimized for your smart phone.

Never Lose Visibility into Your Production
Data-Driven Productivity
Create a culture that “owns the numbers”
Operator Engagement and Productivity
Using SensrTrx to track and display production KPIs shows every employee where they stand and what’s expected. Typically our customers see production numbers increase within a few weeks of using SensTrx just by reporting on these performance numbers.
SensrTrx reporting can be used to:
- track performance against production targets.
- identify top performers.
- address issues before they become systemic problems.
Make Data-Driven Decisions
No more guessing on what’s affecting productivity. SensrTrx puts all your data in context so your employees can make evidence-based decisions on things like scheduling and maintenance. Use trend reporting and paretos to accelerate root-cause analysis of issues in the plant. Dashboards can configured with Pareto graphs, exported to pivot tables, and customized by role.
See data by:
– Facility
– Department
– Cell
– Production Shift
– Team
– Production Day

Analyze Historical Trends Data
SensrTrx stores over 5 years of production data which can be viewed to provide historical context and trend analysis. See the top impacts on productivity throughout the plant and calculate their effect on your bottom-line. View or export your data for daily, weekly, monthly, quarterly or yearly reviews as needed.
I'm Ready To Start
Great! Give us a bit more information and we’ll reach out to you today.